Troubleshooting Problems
Setting up a project is also about having the right tools to debug problems. Fortunately, many nice helpers are already included as part of the webapp package.
Discovering the Symfony Debugging Tools
To begin with, the Symfony Profiler is a time saver when you need to find the root cause of a problem.
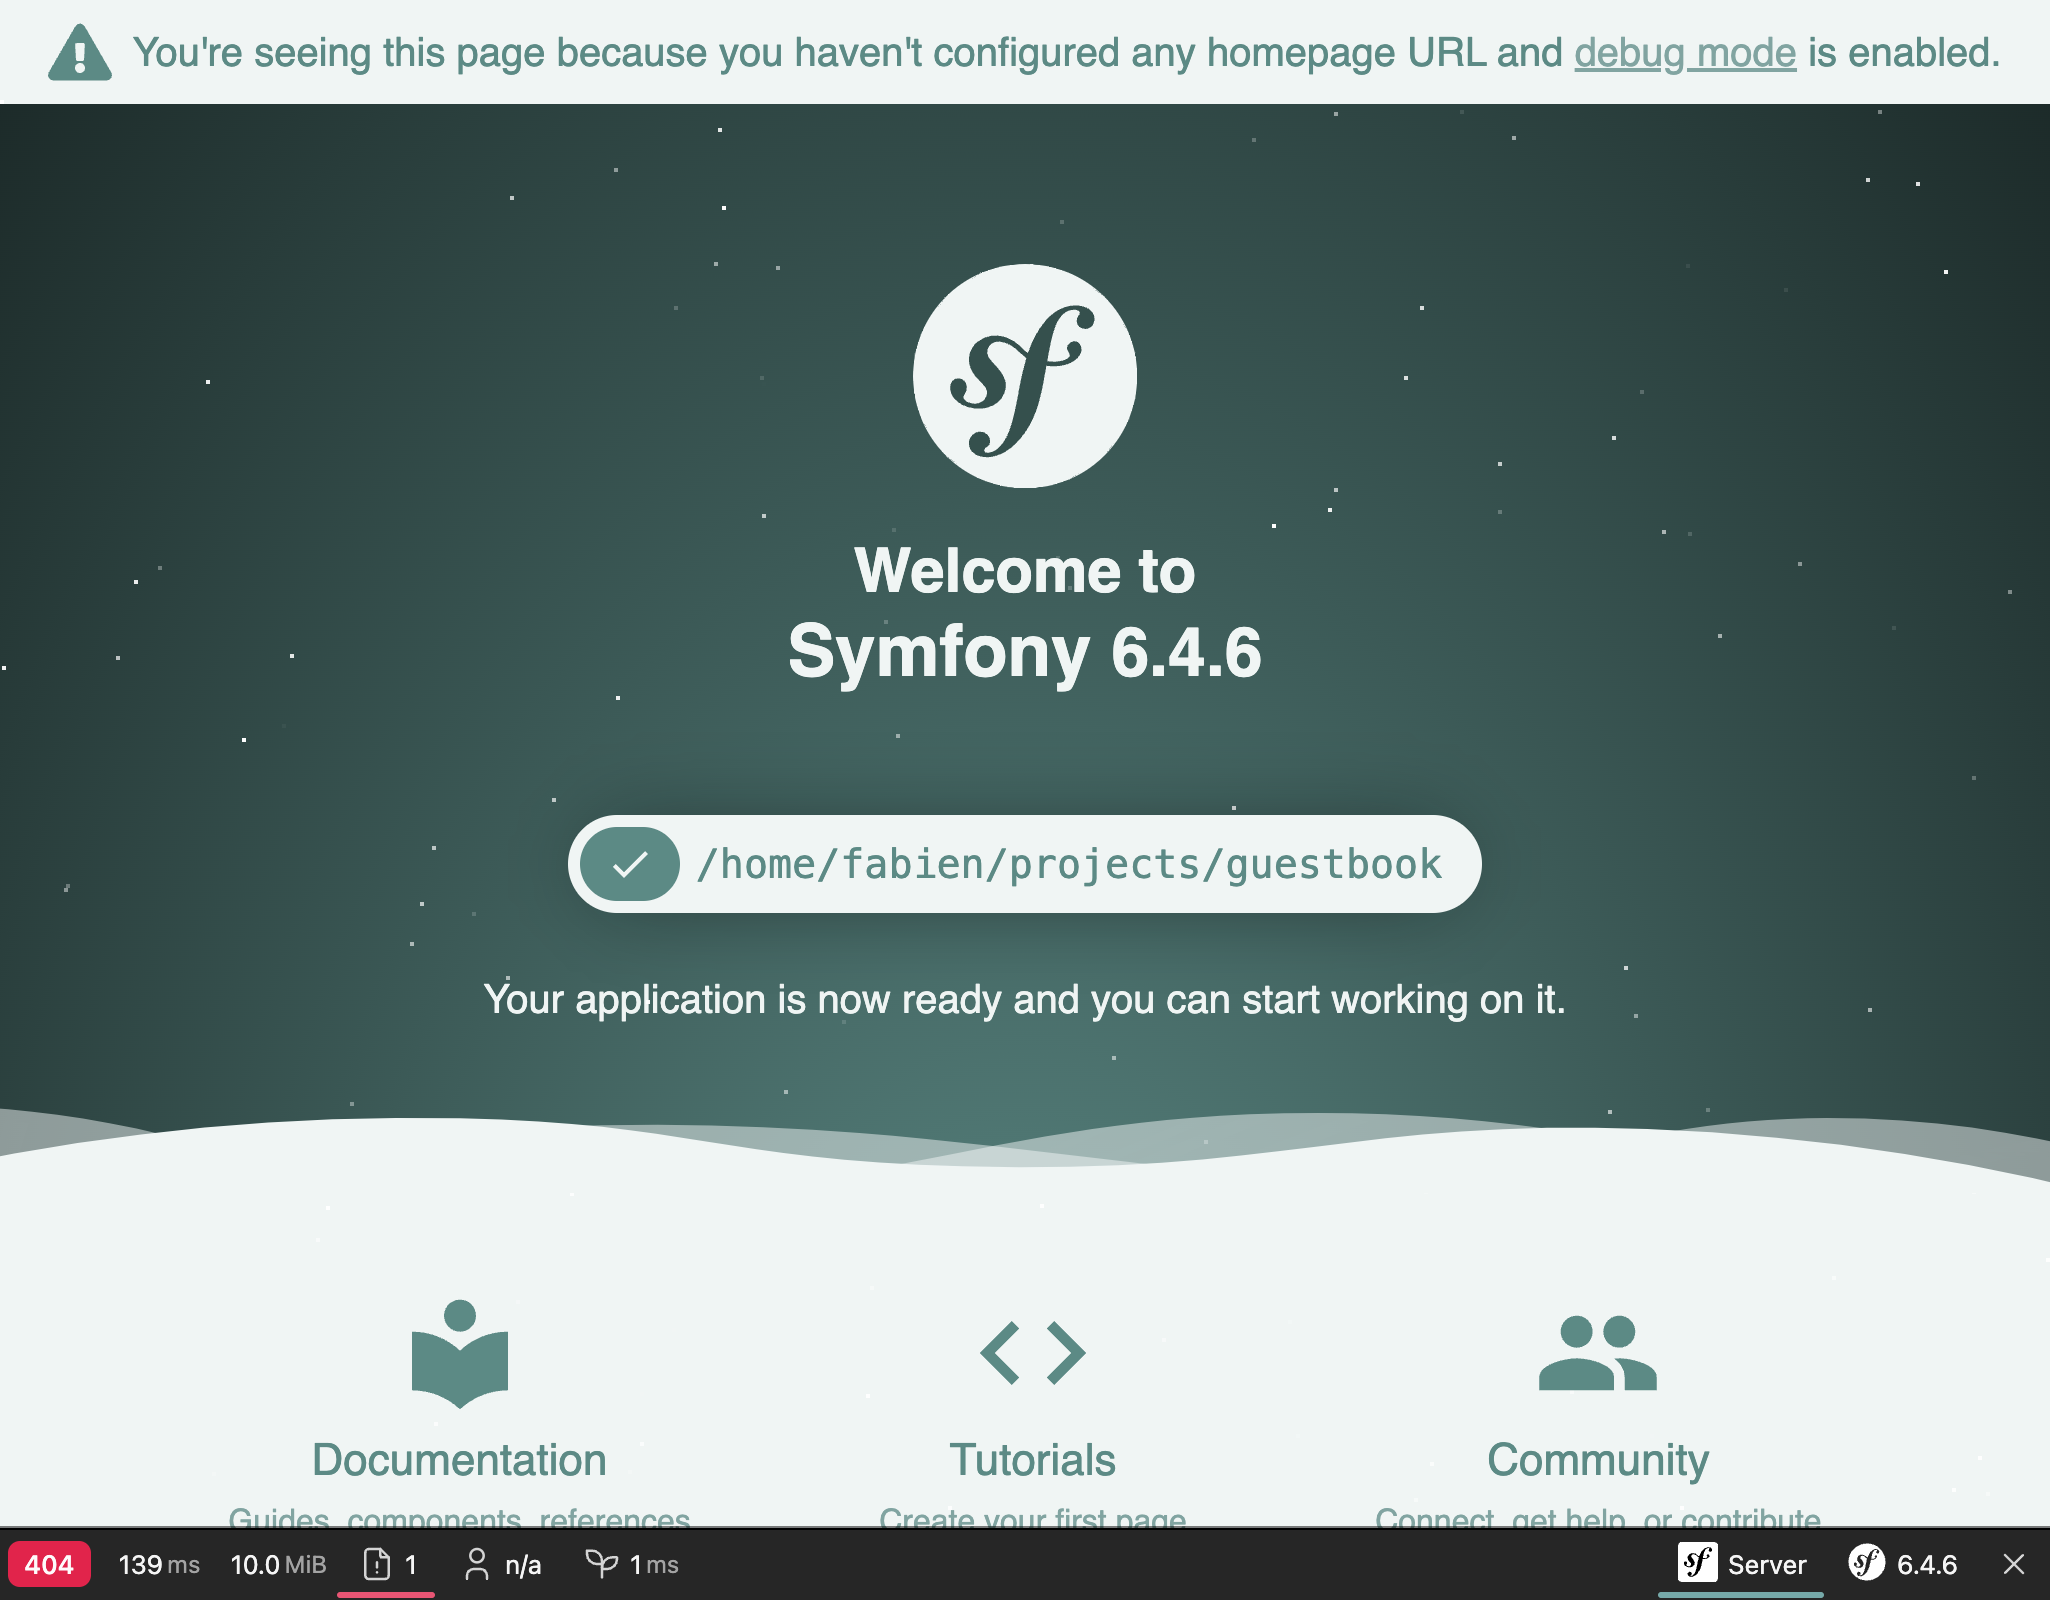
If you have a look at the homepage, you should see a toolbar at the bottom of the screen:

The first thing you might notice is the 404 in red. Remember that this page is a placeholder as we have not defined a homepage yet. Even if the default page that welcomes you is beautiful, it is still an error page. So the correct HTTP status code is 404, not 200. Thanks to the web debug toolbar, you have the information right away.
If you click on the small exclamation point, you get the "real" exception message as part of the logs in the Symfony profiler. If you want to see the stack trace, click on the "Exception" link on the left menu.
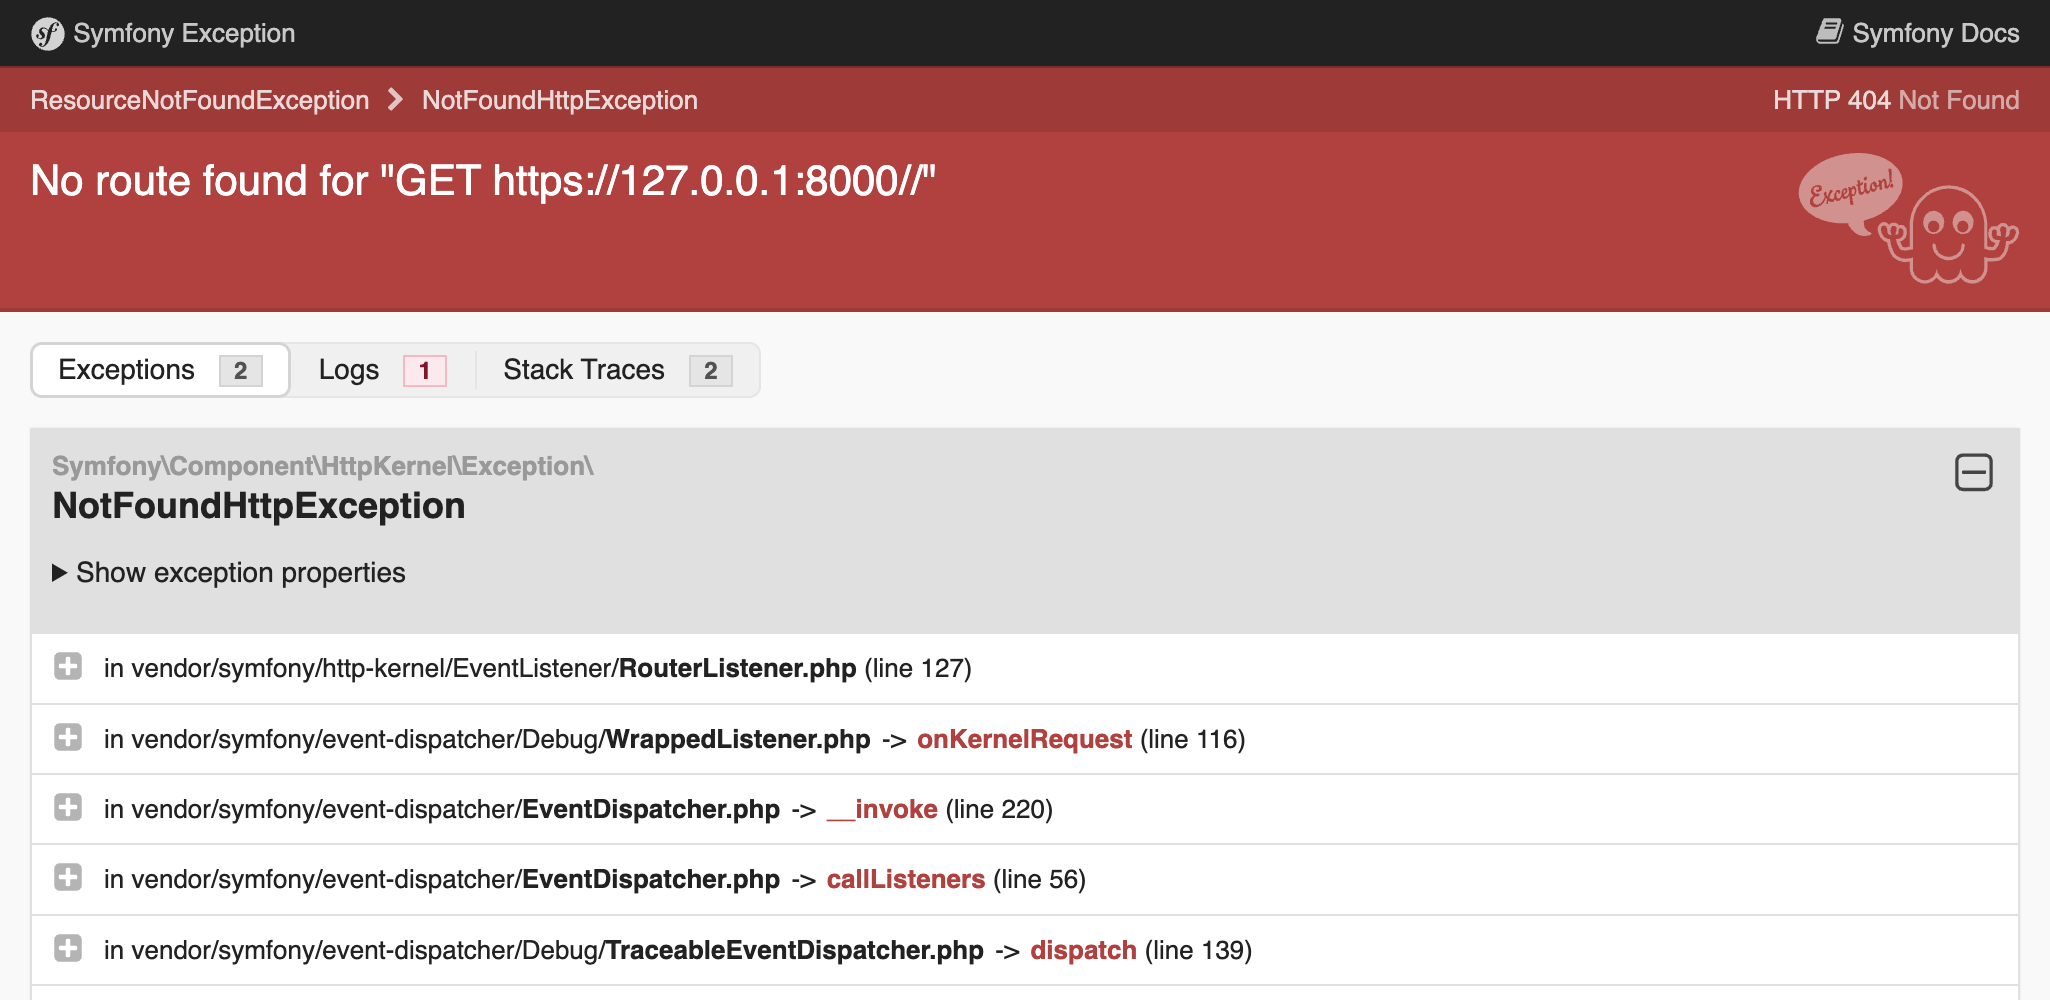
Whenever there is an issue with your code, you will see an exception page like the following that gives you everything you need to understand the issue and where it comes from:

Take some time to explore the information inside the Symfony profiler by clicking around.
Logs are also quite useful in debugging sessions. Symfony has a convenient command to tail all the logs (from the web server, PHP, and your application):
1
$ symfony server:logLet's do a small experiment. Open public/index.php and break the PHP code there (add foobar in the middle of the code for instance). Refresh the page in the browser and observe the log stream:
1
2
Dec 21 10:04:59 |DEBUG| PHP    PHP Parse error:  syntax error, unexpected 'use' (T_USE) in public/index.php on line 5 path="/usr/bin/php7.42" php="7.42.0"
Dec 21 10:04:59 |ERROR| SERVER GET  (500) / ip="127.0.0.1"
The output is beautifully colored to get your attention on errors.
Understanding Symfony Environments
As the Symfony Profiler is only useful during development, we want to avoid it being installed in production. By default, Symfony automatically installed it only for the dev and test environments.
Symfony supports the notion of environments. By default, it has built-in support for three, but you can add as many as you like: dev, prod, and test. All environments share the same code, but they represent different configurations.
For instance, all debugging tools are enabled in the dev environment. In the prod one, the application is optimized for performance.
Switching from one environment to another can be done by changing the APP_ENV environment variable.
When you deployed to Platform.sh, the environment (stored in APP_ENV) was automatically switched to prod.
Managing Environment Configurations
APP_ENV can be set by using "real" environment variables in your terminal:
1
$ export APP_ENV=devUsing real environment variables is the preferred way to set values like APP_ENV on production servers. But on development machines, having to define many environment variables can be cumbersome. Instead, define them in a .env file.
A sensible .env file was generated automatically for you when the project was created:
1
2
3
4
5
6
###> symfony/framework-bundle ###
APP_ENV=dev
APP_SECRET=c2927f273163f7225a358e3a1bbbed8a
#TRUSTED_PROXIES=127.0.0.1,127.0.0.2
#TRUSTED_HOSTS='^localhost|example\.com$'
###< symfony/framework-bundle ###
Tip
Any package can add more environment variables to this file thanks to their recipe used by Symfony Flex.
The .env file is committed to the repository and describes the default values from production. You can override these values by creating a .env.local file. This file should not be committed and that's why the .gitignore file is already ignoring it.
Never store secret or sensitive values in these files. We will see how to manage secrets in another step.
Configuring your IDE
In the development environment, when an exception is thrown, Symfony displays a page with the exception message and its stack trace. When displaying a file path, it adds a link that opens the file at the right line in your favorite IDE. To benefit from this feature, you need to configure your IDE. Symfony supports many IDEs out of the box; I'm using Visual Studio Code for this project:
1
2
3
4
5
6
7
--- a/php.ini
+++ b/php.ini
@@ -5,3 +5,4 @@ max_execution_time=30
 session.use_strict_mode=On
 realpath_cache_ttl=3600
 zend.detect_unicode=Off
+xdebug.file_link_format=vscode://file/%f:%l
Linked files are not limited to exceptions. For instance, the controller in the web debug toolbar becomes clickable after configuring the IDE.
Debugging Production
Debugging production servers is always trickier. You don't have access to the Symfony profiler for instance. Logs are less verbose. But tailing the logs is possible:
1
$ symfony cloud:logs --tailYou can even connect via SSH on the web container:
1
$ symfony cloud:sshDon't worry, you cannot break anything easily. Most of the filesystem is read-only. You won't be able to do a hot fix in production. But you will learn a much better way later in the book.
Going Further

