New in Symfony 2.7: Twig Profiler
April 14, 2015
•
Published by
![]() Javier Eguiluz
Javier Eguiluz
Warning: This post is about an unsupported Symfony version. Some of this information may be out of date. Read the most recent Symfony Docs.
In Symfony project we believe that all the information relevant to developers should be one click away. That's why in Symfony 2.7 we've added a new panel with Twig information in the web debug toolbar.
Currently, the information about the resources used to render each template is displayed in the Timeline panel of the Symfony profiler:
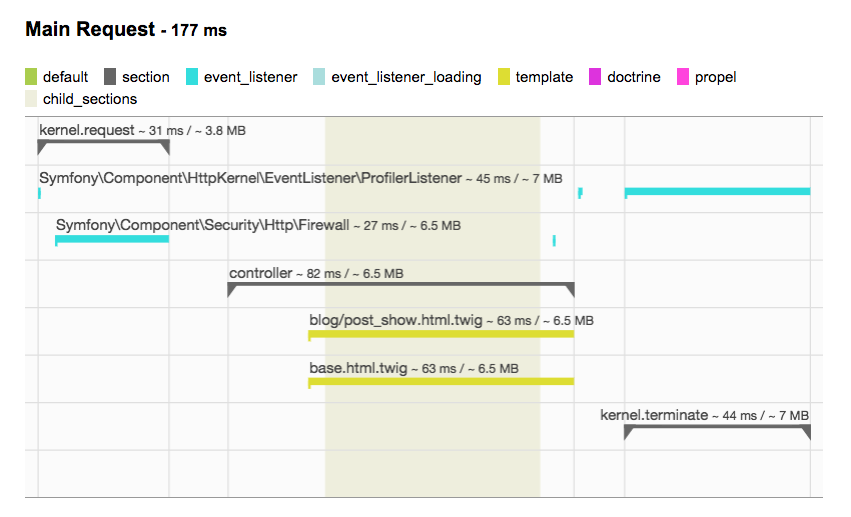
Sadly, this panel doesn't provide much detail for templates. Moreover, some templates aren't registered, so their information is missing in that panel.
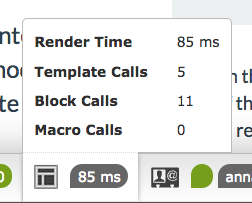
Symfony 2.7 solves these problems thanks to the new profiler introduced by Twig in its 1.18.0 version. First, you'll see a new Twig debug panel in the web debug toolbar that gives you a quick overview of the main Twig stats:
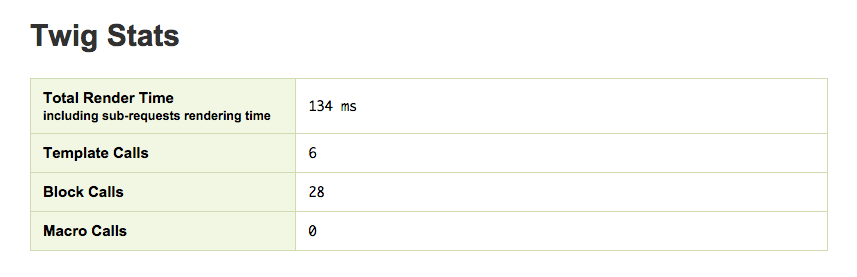
If you click on that panel, you'll see the full information collected by the Twig profiler. First, you'll get the main Twig stats for the page, which is the first thing to check when things go wrong:
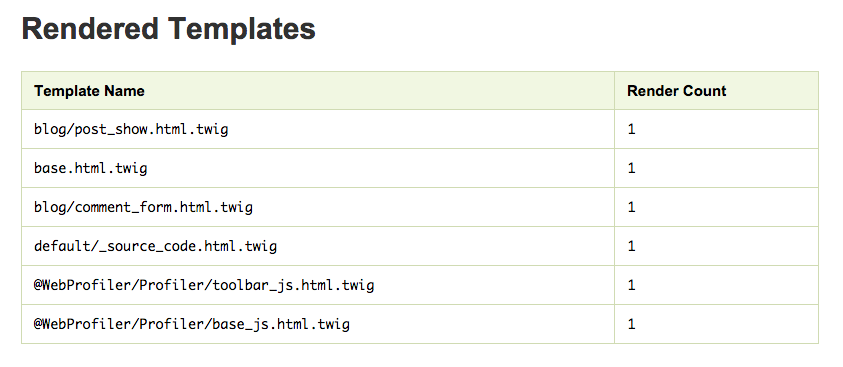
Second, you'll see the full list of templates used to render the page, including the templates of third-party bundles and the template fragments:
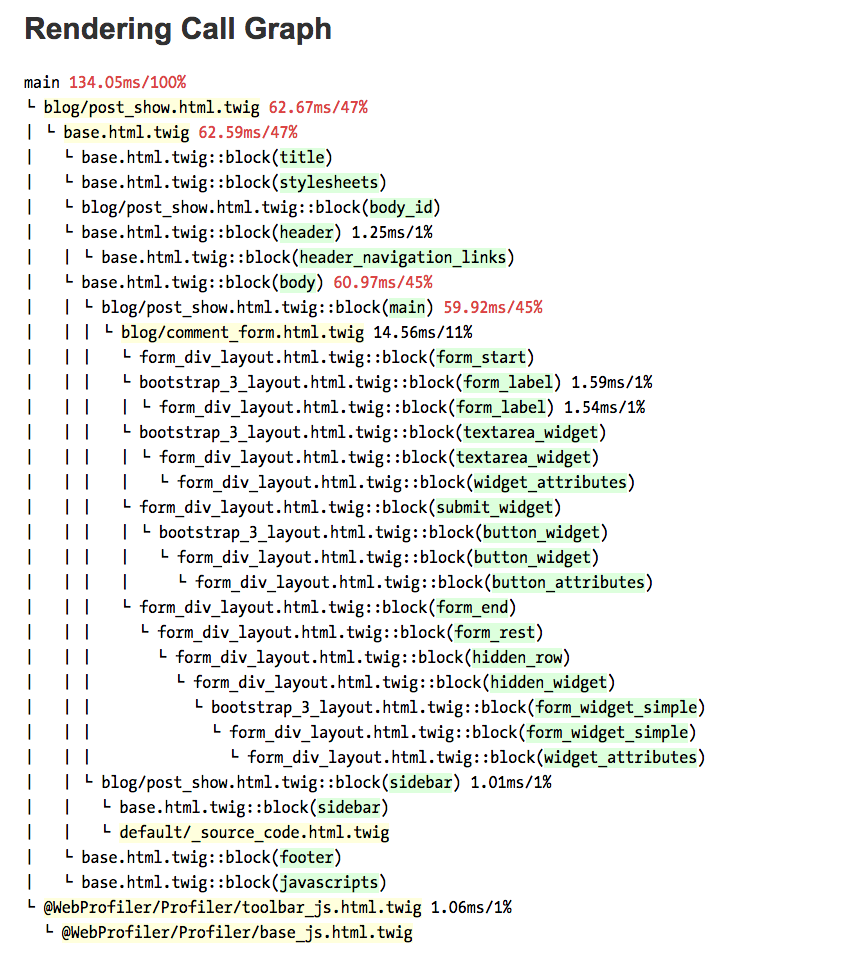
Lastly, you'll get the full call graph executed by Twig to render the page. This information is mostly useful when things go wrong or your templates render slowly. Thanks to the detailed information, you'll discover the performance bottlenecks instantly:
Symfony 2.7 enables the Twig profiler automatically when the application uses the
debug mode. If you are using Twig outside of Symfony, you must register the
new profiler extension before rendering the templates:
1
2
3
4
5
6
7
$profile = new Twig_Profiler_Profile();
$twig->addExtension(new Twig_Extension_Profiler($profile));

// render templates ...

$dumper = new Twig_Profiler_Dumper_Text();
echo $dumper->dump($profile);
In addition to the basic text dumper (which is the one used by Symfony), Twig also includes an advanced dumper to output the call graph information in a format compatible with the Blackfire Profiler.
Help the Symfony project!
As with any Open-Source project, contributing code or documentation is the most common way to help, but we also have a wide range of sponsoring opportunities.
Comments are closed.
To ensure that comments stay relevant, they are closed for old posts.