New in Symfony 7.1: WebProfiler Improvements
May 10, 2024
•
Published by
![]() Javier Eguiluz
Javier Eguiluz
Symfony 7.1 is backed by:
The Symfony profiler is a debugging tool that provides detailed information about the execution of any HTTP request or console command. In Symfony 7.1, we've added several improvements to it.
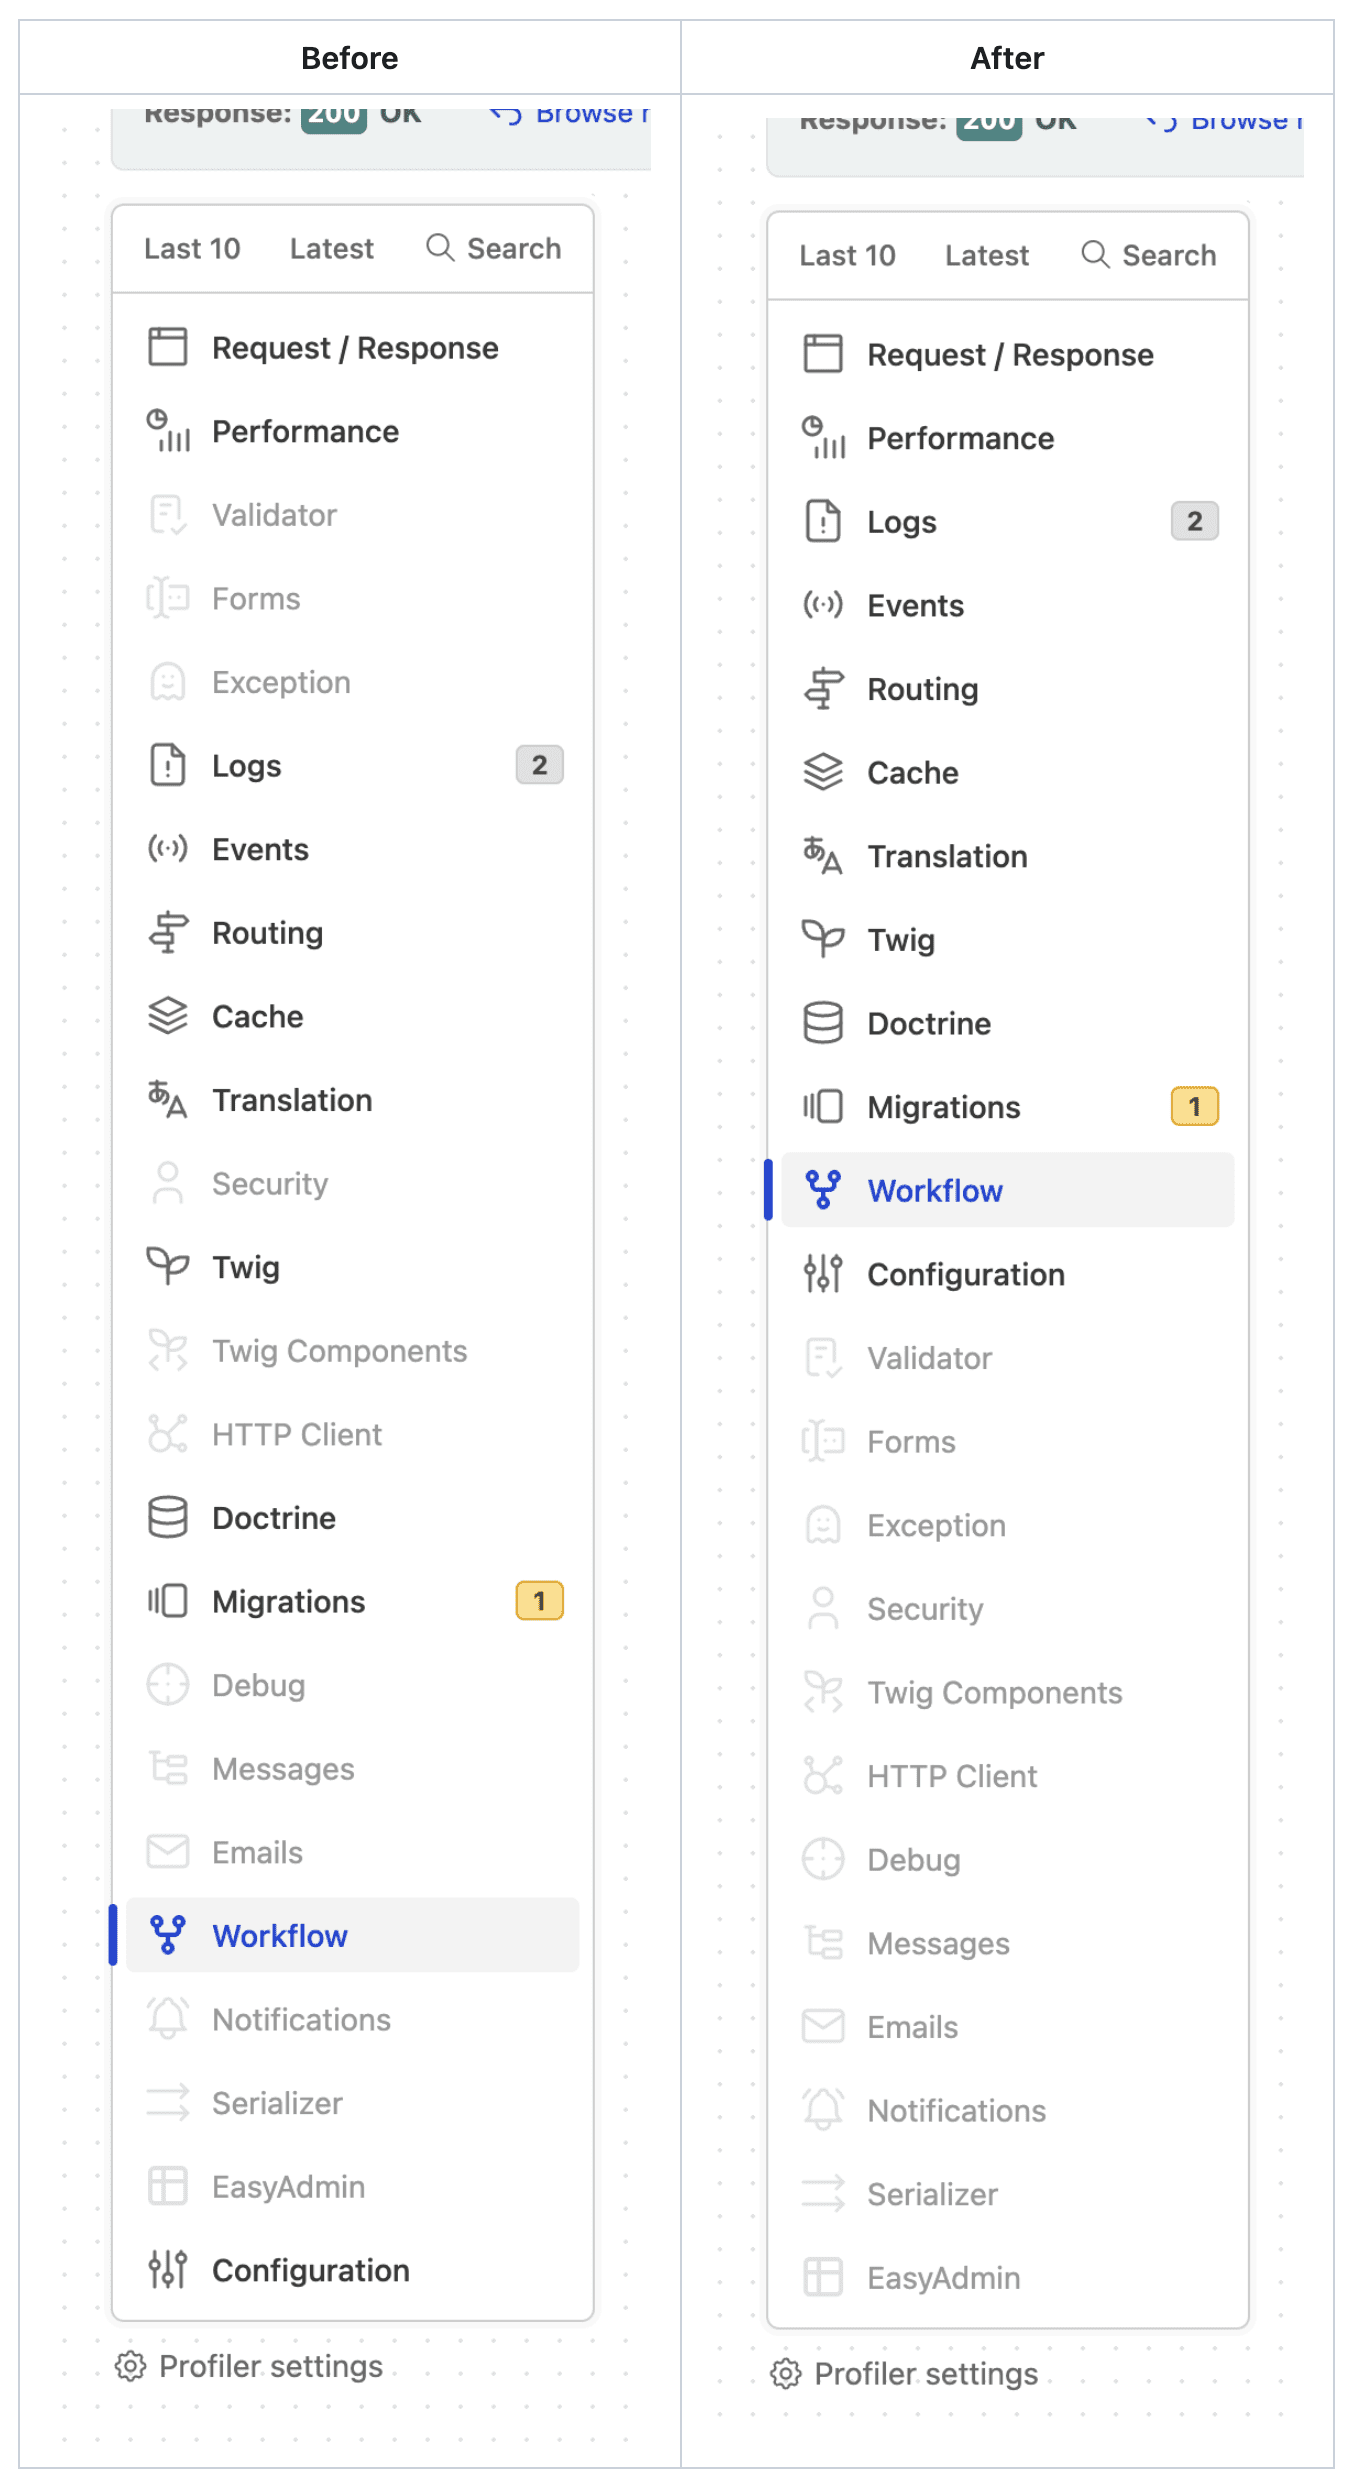
First, the sidebar menu now displays the active menu items first, to avoid distracting you with panels that don't contain any information relevant to that request/command:

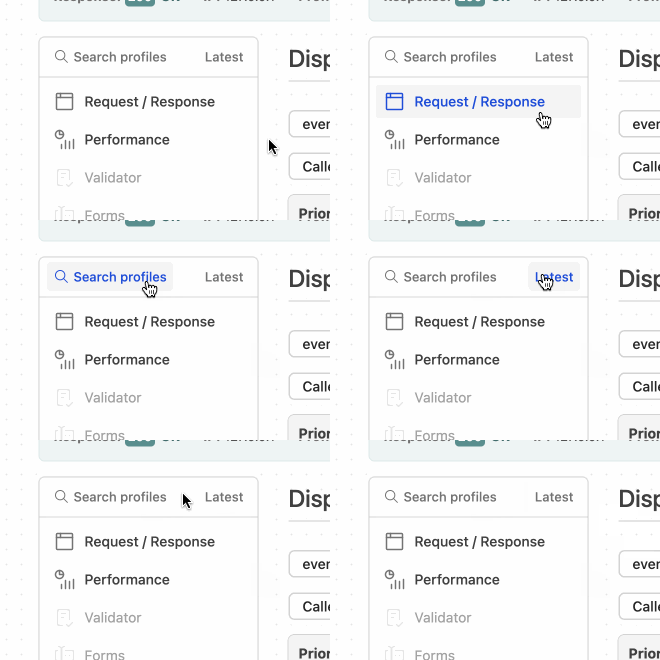
We've also improved the performance of the profiler web UI. As part of this enhancement, the search form was removed from the sidebar to prevent an unpleasant page jump when loading complex profiler panels. The search form is still just one click away in the redesigned top section of the sidebar:

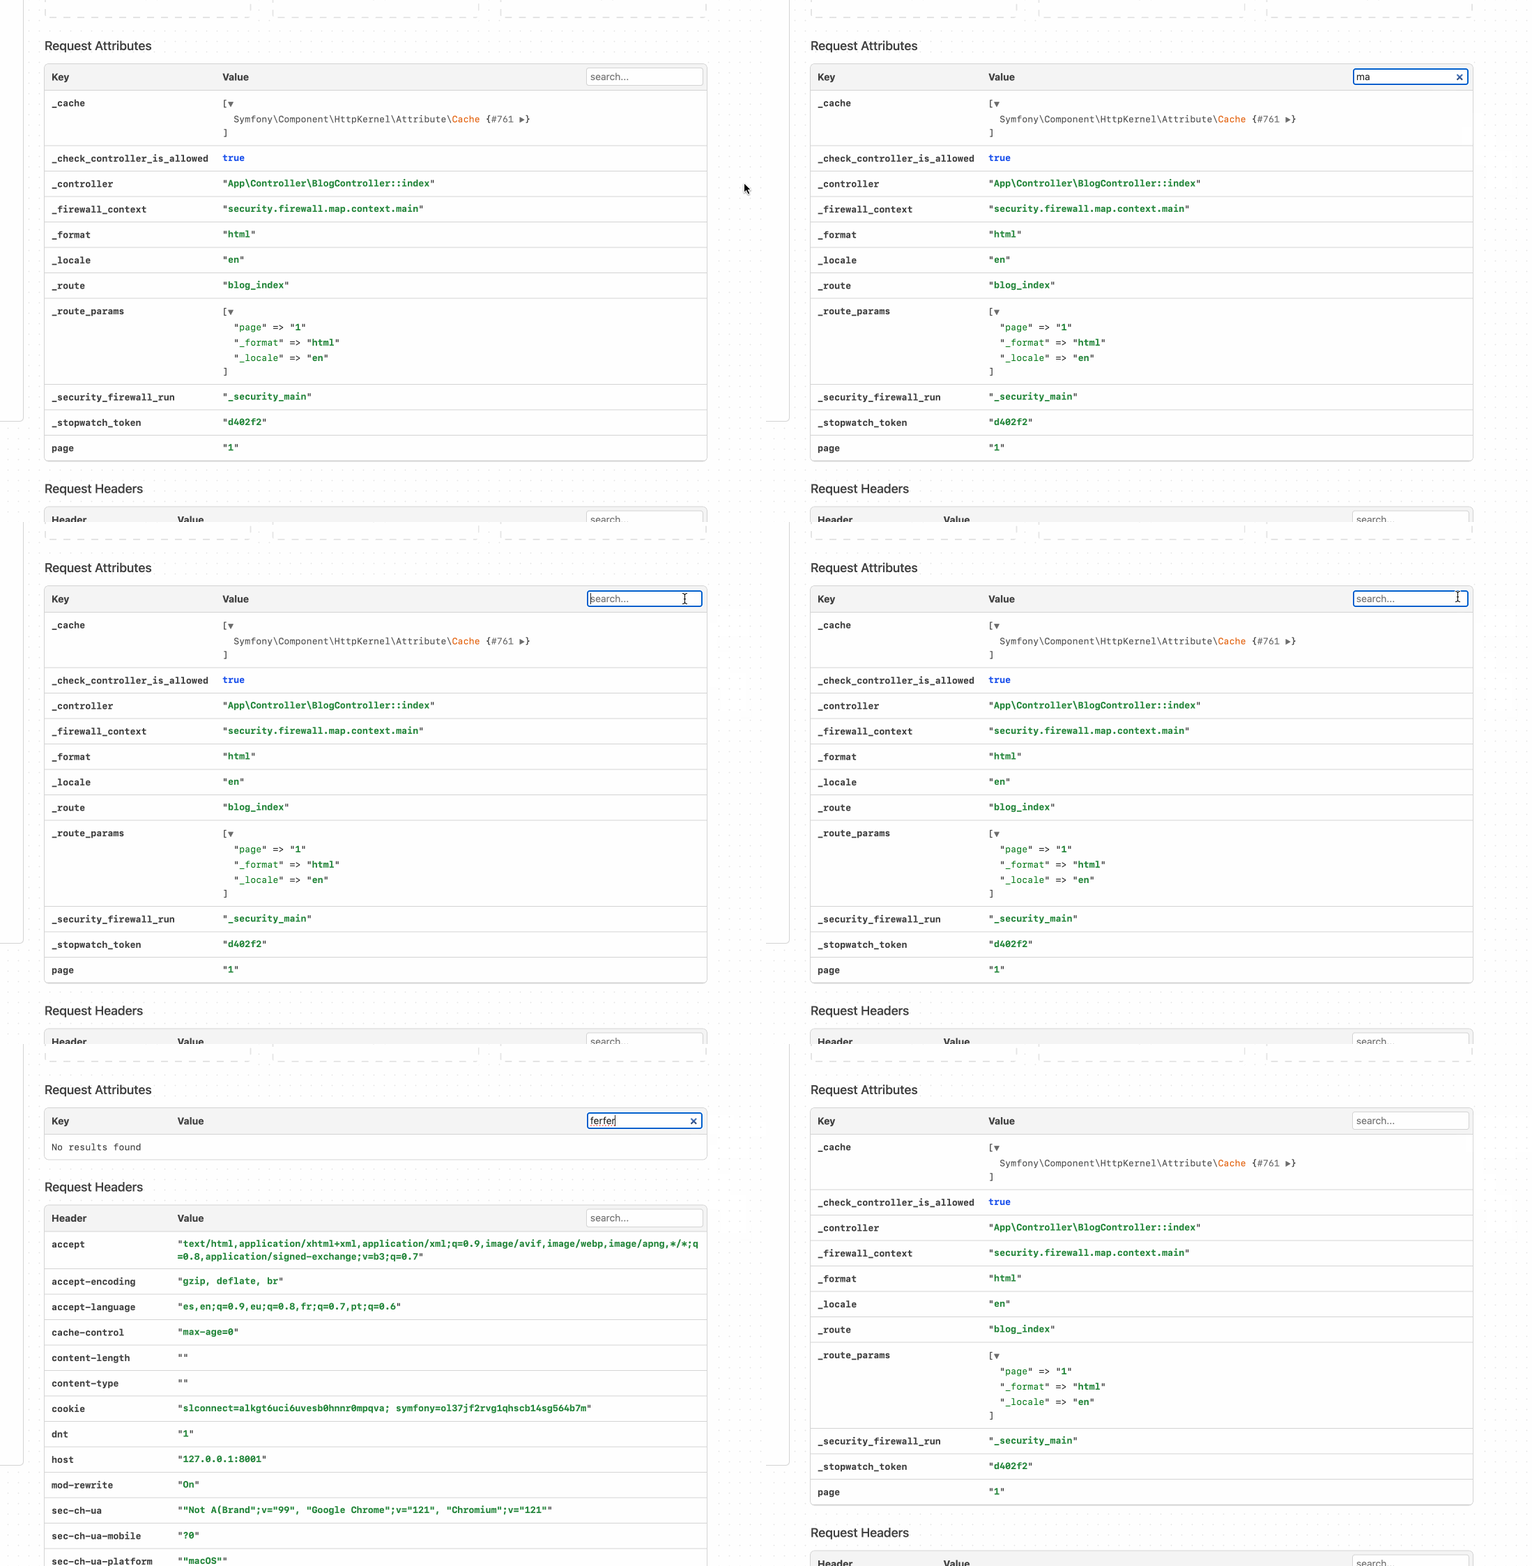
In many profiler panels, you will see long tables of key-value rows. In Symfony 7.1, these tables will now include a search input injected dynamically via JavaScript:

This search input allows you to filter the table contents in real-time. Simply type anything, and you'll only see the rows that contain that text in any of its cells:

Additional improvements that were added to the Profiler in Symfony 7.1:
- In PR 52950, Adrian Günter improved the JavaScript code of the toolbar to avoid triggering Xdebug for toolbar requests when using the Xdebug browser extension;
- In PR 54364, the design of the Workflow panel has been improved.
Help the Symfony project!
As with any Open-Source project, contributing code or documentation is the most common way to help, but we also have a wide range of sponsoring opportunities.
Comments are closed.
To ensure that comments stay relevant, they are closed for old posts.