Getting a Stack Trace
When reporting a bug for an exception or a wrong behavior in code, it is crucial that you provide one or several stack traces. To understand why, you first have to understand what a stack trace is, and how it can be useful to you as a developer, and also to library maintainers.
Anatomy of a Stack Trace
A stack trace is called that way because it allows one to see a trail of
function calls leading to a point in code since the beginning of the
program. That point is not necessarily an exception. For instance, you
can use the native PHP function debug_print_backtrace() to get such
a trace. For each line in the trace, you get a file and a function or
method call, and the line number for that call. This is often of great
help for understanding the flow of your program and how it can end up in
unexpected places, such as lines of code where exceptions are thrown.
Stack Traces and Exceptions
In PHP, every exception comes with its own stack trace, which is
displayed by default if the exception is not caught. When using Symfony,
such exceptions go through a custom exception handler, which enhances
them in various ways before displaying them according to the current
Server API (CLI or not).
This means a better way to get a stack trace when you do not need the
program to continue is to throw an exception, as follows:
throw new \Exception();
Nested Exceptions
When applications get bigger, complexity is often tackled with layers of
architecture that need to be kept separate. For instance, if you have a
web application that makes a call to a remote API, it might be good to
wrap exceptions thrown when making that call with exceptions that have
special meaning in your domain, and to build appropriate HTTP exceptions
from those. Exceptions can be nested by using the $previous
argument that appears in the signature of the Exception class:
public __construct ([ string $message = "" [, int $code = 0 [, Throwable $previous = NULL ]]] )
This means that sometimes, when you get an exception from an
application, you might actually get several of them.
What to look for in a Stack Trace
When using a library, you will call code that you did not write. When
using a framework, it is the opposite: because you follow the
conventions of the framework, the framework finds your code and calls it, and does
things for you beforehand, like routing or access control.
Symfony being both a framework and library of components, it calls your
code and then your code might call it. This means you will always have
at least 2 parts, very often 3 in your stack traces when using Symfony:
a part that starts in one of the entry points of the framework
(bin/console or public/index.php in most cases), and ends when
reaching your code, most times in a command or in a controller found under
src. Then, either the exception is thrown in your code or in
libraries you call. If it is the latter, there should be a third part in
the stack trace with calls made in files under vendor. Before
landing in that directory, code goes through numerous review processes
and CI pipelines, which means it should be less likely to be the source
of the issue than code from your application, so it is important that
you focus first on lines starting with src, and look for anything
suspicious or unexpected, like method calls that are not supposed to
happen.
Next, you can have a look at what packages are involved. Files under
vendor are organized by Composer in the following way:
vendor/acme/router where acme is the vendor, router the
library and acme/router the Composer package. If you plan on
reporting the bug, make sure to report it to the library throwing the
exception. composer home acme/router should lead you to the right
place for that. As Symfony is a mono-repository, use composer home
symfony/symfony when reporting a bug for any component.
Getting Stack Traces with Symfony
Now that we have all this in mind, let us see how to get a stack trace with Symfony.
Stack Traces in your Web Browser
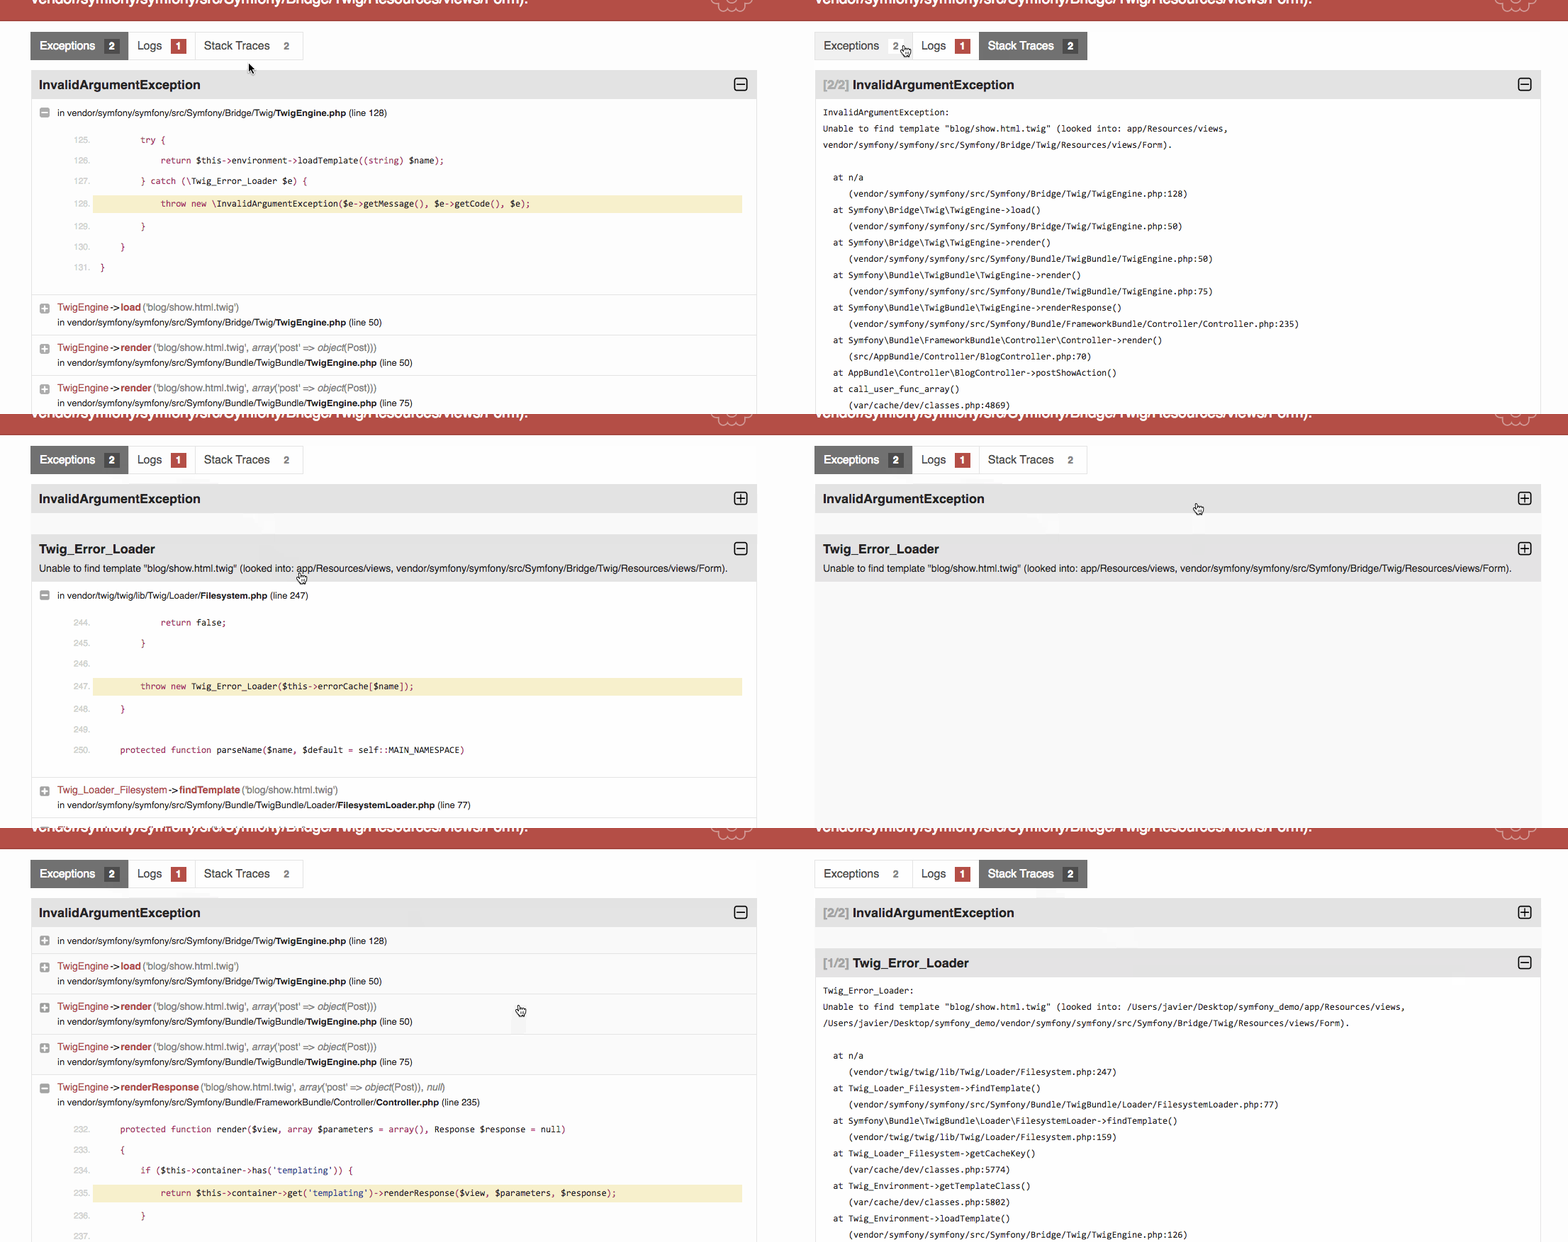
Several things need to be paid attention to when picking a stack trace from your development environment through a web browser:
- Are there several exceptions? If yes, the most interesting one is
often exception 1/n which, is shown last in the default exception page
(it is the one marked as
exception [1/2]in the below example). - Under the "Stack Traces" tab, you will find exceptions in plain text, so that you can easily share them in e.g. bug reports. Make sure to remove any sensitive information before doing so.
- You may notice there is a logs tab too; this tab does not have to do with stack traces, it only contains logs produced in arbitrary places in your application. They may or may not relate to the exception you are getting, but are not what the term "stack trace" refers to.

Since stack traces may contain sensitive data, they should not be exposed in production. Getting a stack trace from your production environment, although more involving, is still possible with solutions that include but are not limited to sending them to an email address with Monolog.
Stack Traces in the CLI
Exceptions might occur when running a Symfony command. By default, only the message is shown because it is often enough to understand what is going on:
1
2
3
4
5
6
7
8
9
10
11
12
13
14
$ php bin/console debug:exception


   Command "debug:exception" is not defined.

   Did you mean one of these?
       debug:autowiring
       debug:config
       debug:container
       debug:event-dispatcher
       debug:form
       debug:router
       debug:translation
       debug:twig
If that is not the case, you can obtain a stack trace by increasing the
verbosity level with --verbose:
1
2
3
4
5
6
7
8
9
10
11
12
13
14
15
16
17
18
19
20
21
22
23
24
25
$ php bin/console --verbose debug:exception

 In Application.php line 644:

   [Symfony\Component\Console\Exception\CommandNotFoundException]
   Command "debug:exception" is not defined.

   Did you mean one of these?
       debug:autowiring
       debug:config
       debug:container
       debug:event-dispatcher
       debug:form
       debug:router
       debug:translation
       debug:twig


 Exception trace:
   at /app/vendor/symfony/console/Application.php:644
  Symfony\Component\Console\Application->find() at /app/vendor/symfony/framework-bundle/Console/Application.php:116
  Symfony\Bundle\FrameworkBundle\Console\Application->find() at /app/vendor/symfony/console/Application.php:228
  Symfony\Component\Console\Application->doRun() at /app/vendor/symfony/framework-bundle/Console/Application.php:82
  Symfony\Bundle\FrameworkBundle\Console\Application->doRun() at /app/vendor/symfony/console/Application.php:140
  Symfony\Component\Console\Application->run() at /app/bin/console:42
Stack Traces and API Calls
When getting an exception from an API, you might not get a stack trace,
or it might be displayed in a way that is not suitable for sharing.
Luckily, when in the dev environment, you can obtain a plain text stack
trace by using the profiler. To find the profile, you can have a look
at the X-Debug-Token-Link response headers:
1
2
3
4
5
6
$ curl --head http://localhost:8000/api/posts/1
… more headers
X-Debug-Token: 110e1e
X-Debug-Token-Link: http://localhost:8000/_profiler/110e1e
X-Robots-Tag: noindex
X-Previous-Debug-Token: 209101
Following that link will lead you to a page very similar to the one described above in Stack Traces in your Web Browser.

